2
94
K. Yu et al. / Journal of Catalysis 365 (2018) 292–302
analyzed by HPLC. The concentrations of HMF, HMFCA, FFCA, and
FDCA in the reaction solutions were measured by HPLC using the
external standard calibration curve method. To evaluate the rela-
tive standard deviation (RSD) of the reaction results, four parallel
fewer oxygen vacancies [32]. In addition, the wide peaks of these
patterns indicate that the crystal sizes are quite small.
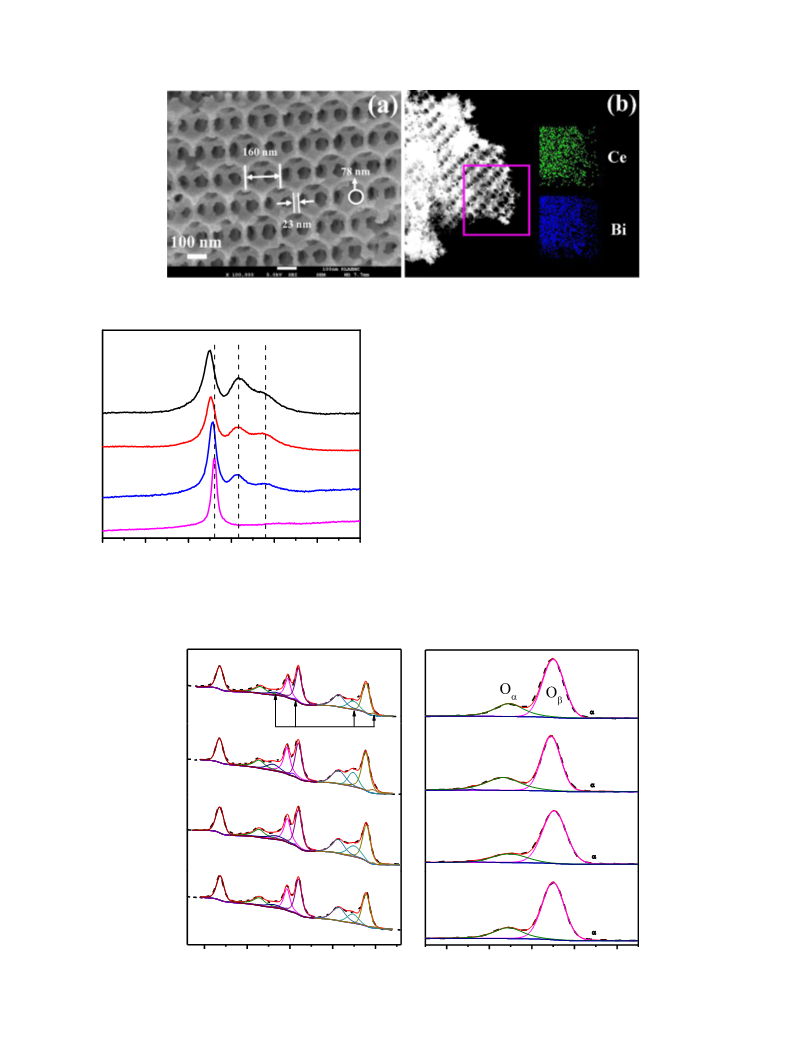
A typical SEM image of 3DOM-Ce1ꢀxBi
x
O
2ꢀd (x = 0.2) is shown in
2ꢀd at lower magnifi-
Fig. 2a. More SEM images of 3DOM-Ce1ꢀxBi
x
O
experiments were carried out by using Pt/3DOM-Ce0.8Bi0.2
catalyst. The RSD values for yield of HMFCA, FFCA, and FDCA were
determined as 1.7%, 2.4%, and 2.5%, respectively.
O
2ꢀd as
cations are shown in Fig. S2. It can be seen from these images that a
well-ordered array of cages, with an inverse opal structure, appears
in the porous specimens. A typical diameter of the cages (negative
replica of the close packed PMMA colloidal spheres) is about 160
nm, implying a shrinkage of ca. 47% in comparison with the size
of PMMA spheres. The cages are interconnected via open windows
about 78 nm in diameter, and the average thickness of cage walls is
about 23 nm. EDS elemental mapping of 3DOM-Ce0.8Bi0.2O2ꢀd exhi-
bits even distributions of both Ce and Bi elements in this solid solu-
tion material, as shown in Fig. 2b.
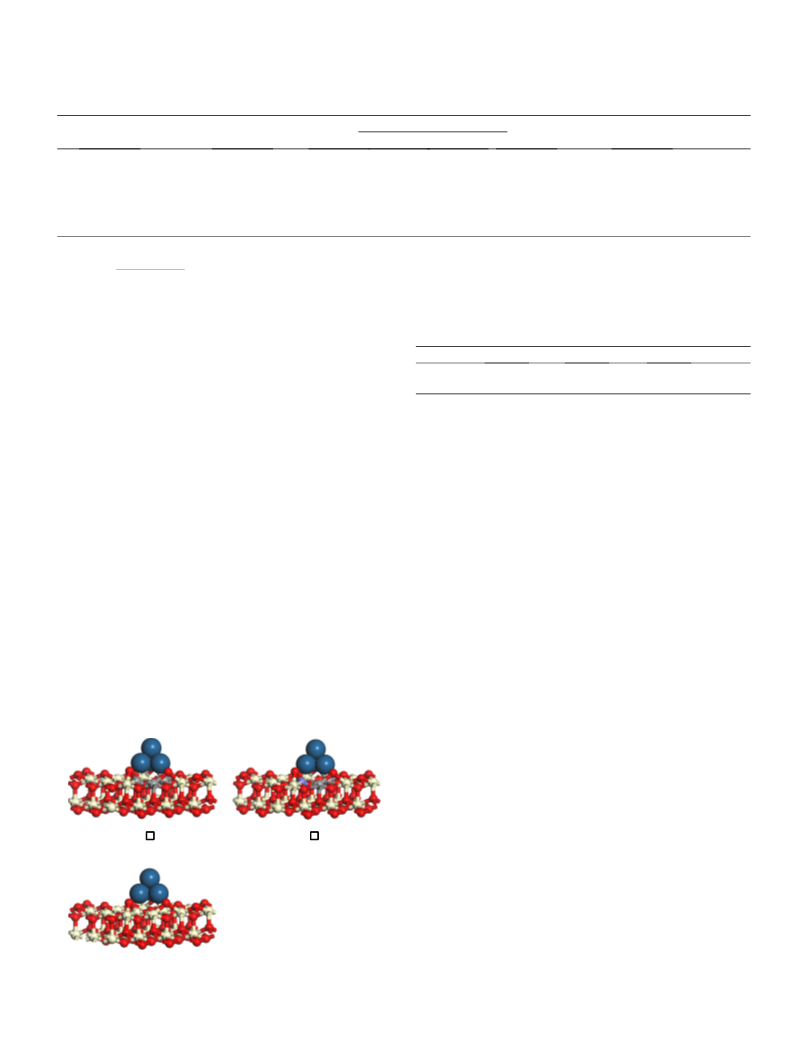
2.6. Computational methods
The DFT + U calculation using the Vienna ab initio simulation
package (VASP) [25,26] was introduced to investigate the thermo-
dynamic properties of obtained solid solution samples. All calcula-
tions in this work used the generalized gradient approximation
The macroporous structure and specific surface areas of these
(
GGA-PW91) [27] as the exchange-correlation functional, and an
3
DOM-Ce1ꢀxBi
sorption method. The type II characteristic isotherms with an H3
hysteresis loop in the relative pressure (p/p ) range 0.8–1.0 were
observed from 3DOM-Ce1ꢀxBi 2ꢀd, indicating the existence of
macroporous structure. The BET surface areas of the 3DOM-
x
O2ꢀd materials were measured by the nitrogen
energy cutoff of 500 eV was used for the plane-wave expansion
of the electronic wave function. The DFT + U method evaluated
the on-site Coulomb and exchange interactions in the localized 4f
orbital electrons of Ce by adding an effective Hubbard U parameter
0
x
O
to repulse electrons on the same orbitals [28,29]. It was reported
p
2
ꢀ1
Ce1ꢀxBi
x
O2ꢀd specimens are in the range 30–42 m
g
(Fig. S3
that the theoretical U value was 5 eV [30,31]. p(2 3 ꢂ 3) slab mod-
and Table S1).
els of Ce(1 1 1) with the top four atomic layers relaxed and the bot-
tom three layers fixed were used in the present work; the
corresponding k-point meshes were set to 2 ꢂ 2 ꢂ 1. The vacuum
space was set to 20 Å between the slabs to minimize their
interaction.
3
+
Bi cations have six-coordination of oxygen in the fluorite-type
d-Bi , leaving two oxygen vacancies in the eight-coordinated
2 3
O
environment. In the present work, Raman spectroscopy was used
to detect any possible local distortion induced by such Bi-doping
(
4
Fig. 3). The spectrum of Bi-free CeO
60 cm , which is assigned to the F2g vibrational mode of cubic
2
displays a strong peak at
ꢀ1
3
. Results and discussion
3+
2
fluorite structure of CeO [33]. With the Bi -doping, this peak
slightly red shifts to a lower wavenumber, suggesting an obvious
variation of the Ce-O bonding symmetry [34]. The peak at 517
3
.1. Characterization of 3DOM-Ce1ꢀxBi O2ꢀd specimens
x
ꢀ1
cm , being absent in pure CeO
the Bi-doping, can be assigned to BiO
2
and increasing in intensity with
octahedral units in
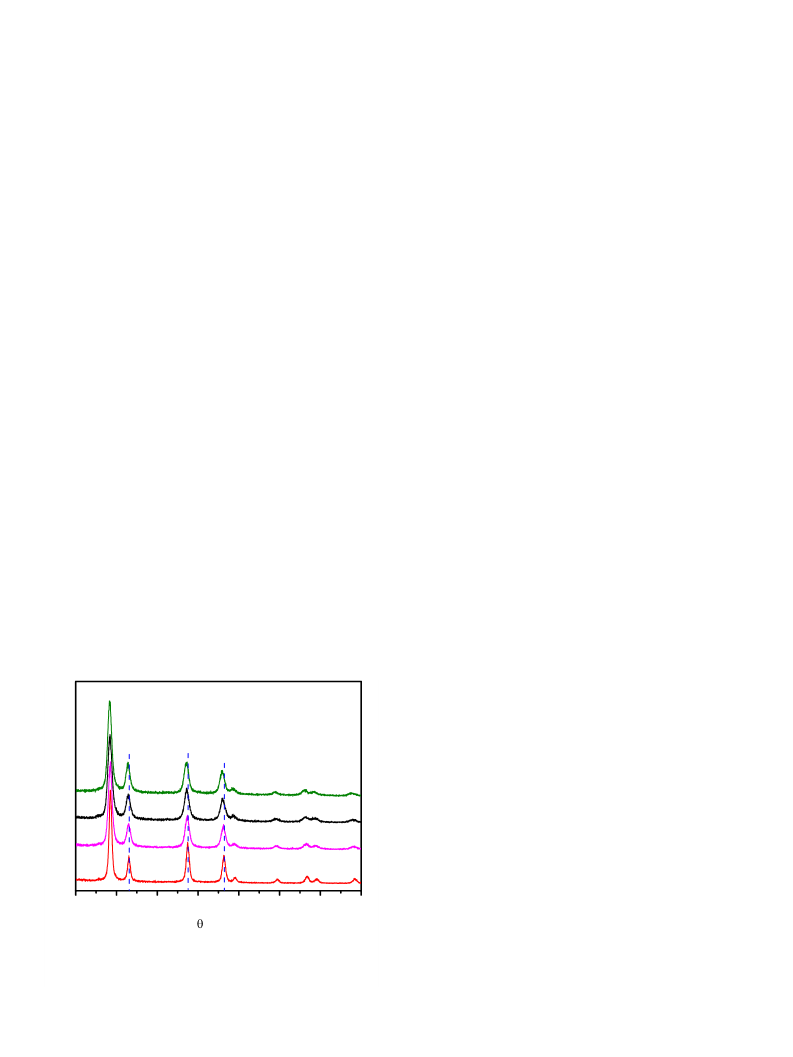
Initial characterization of the 3DOM-Ce1ꢀxBi
by XRD as shown in Fig. 1. All the diffraction peaks can be indexed
onto a CeO -like unit cell, with a peak shift to a lower angle region
corresponding to the Bi-doping, indicating a solid solution state in
the whole compositional range up to the Bi-doping of 30%. This can
be understood, since the high-temperature phase, d-Bi O , also has
2 3
a fluorite structure with 25% oxygen vacancies, which can be stabi-
lized at room temperature in the form of a solid solution with
x
O2ꢀd samples was
6
fluorite-type CeO
fluorite-type d-Bi
in pure CeO
the asymmetric Bi -h(-Ce
2
structure. This peak was also detected from
2
ꢀ1
2
O
3
[35,36]. The peak at 580 cm , also absent
3+
2
, can be assigned to Ce -O bonds associated with
3+
3+
3
) sites [37]. The curve fitting of the
Raman spectra (Fig. S4a–c) suggests that 3DOM-Ce0.8Bi0.2O2ꢀd has
3+
the largest amount of Ce among these specimens.
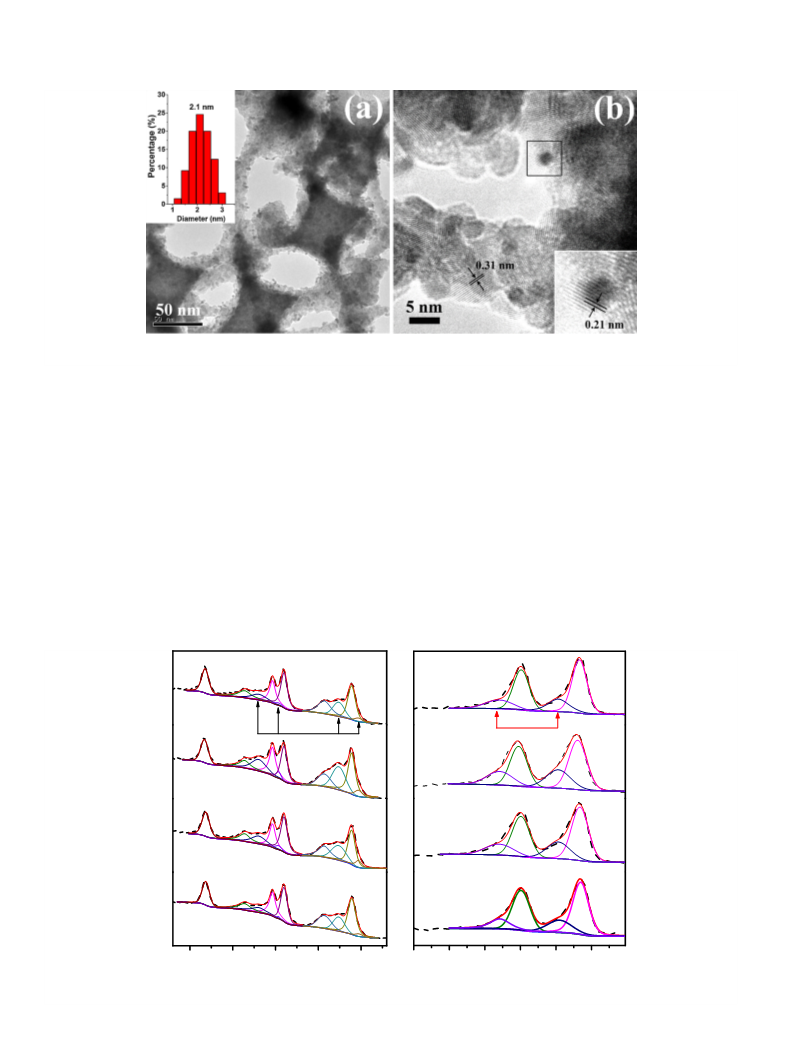
To further quantitatively determine the concentration of Ce3+,
which normally coexists with oxygen vacancies, Ce3d and O1s
XPS spectra of these catalysts were measured. Ten characteristic
peaks are observed in the Ce3d curves (Fig. 4a). The five peaks cen-
tered at 880.6, 882.2, 885.3, 888.8, and 898.0 eV, corresponding to
0
00
000
v
0
,
v
, v , v , and v , respectively, can be attributed to the Ce3d5/2
contributions. The peaks at 899.2, 900.7, 904.0, 907.3, and 916.5
eV, corresponding to u
from the Ce3d3/2 contributions. Among these Ce3d peaks, u , u
0
0
00
000
0
, u, u , u , and u , respectively, are derived
0
0
3+
3+
and
0
v , v can be ascribed to Ce 3d3/2 and Ce 3d5/2, while the
0
0
000
00
000
4+
peaks labeled as u, u , u and
v
, v , v are assigned to Ce 3d3/2
x=0.3
x=0.2
x=0.1
4
+
3+
and Ce 3d5/2, respectively [38,39]. It can be seen that more Ce
species are detected in all the Bi-doped specimens than in the Bi-
2
free CeO . 3DOM-Ce0.8Bi0.2O
2ꢀd exhibits the highest ratio of Ce3+
to total Ce (16.5%) among these specimens.
O1s XPS was employed to study the chemical states of oxygen
in the surface regions of 3DOM-Ce1ꢀxBi
x
O2ꢀd. As shown in Fig. 4b,
x=0
the peaks centered at 529.0–529.1 eV can be attributed to the lat-
2
ꢀ
tice O (denoted as O
b
), and the peaks centered at 531.2–531.4 eV
2
0
30
40
50
2
60
70
80
90
can be assigned to the chemisorbed oxygen species (denoted as
2ꢀ
ꢀ
2
O
a
), such as O
2
and O
[40]. The weak peaks at ꢃ533 eV can be
/(O + O ) repre-
(
degree)
attributed to the absorbed water [41]. The ratio O
a
a
b
sents the oxygen activation capacity of the specimens, which is
normally related to their number of oxygen vacancies. It can be
Fig. 1. XRD patterns of 3DOM-Ce1ꢀxBi
diffraction peaks are indexed to the CeO
a = 0.5416 nm (JCPDS 34-0394). The dashed lines mark the peak positions of the
x = 0 sample.
x
O
2ꢀd specimens with x from 0 to 0.3. The
-like face-centered cubic unit cell with
2
found that 3DOM-Ce0.8Bi0.2
O2ꢀd exhibits the largest amount of
O
a
, which is well consistent with the results of Ce3d XPS.

 Yu, Kai